U-Behavior App Users Frequently Asked Questions
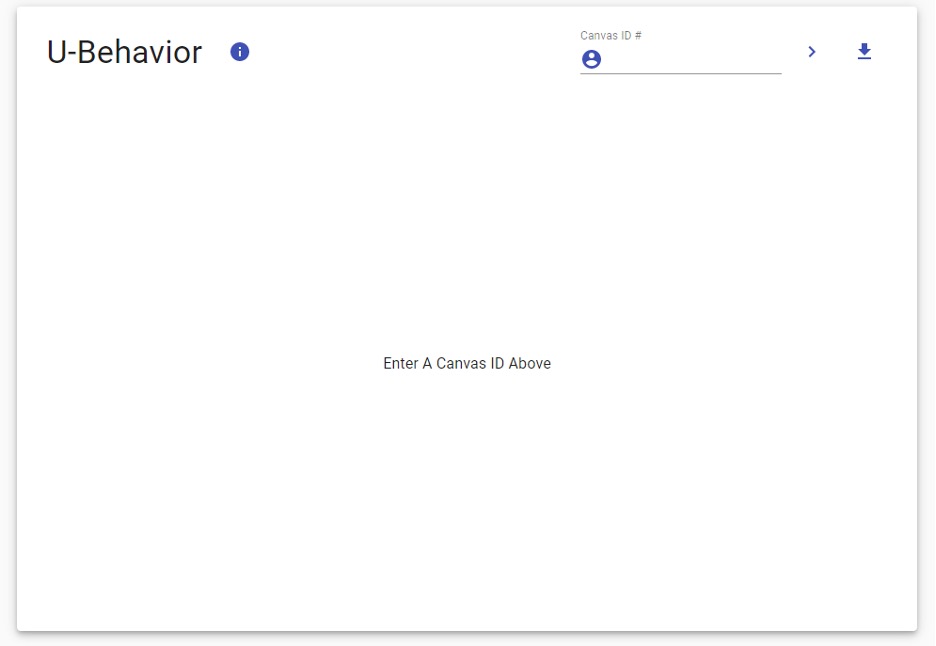
Why is U-Behavior spinning? Why can't I see my RPA graph?
U-Behavior does not work with some older versions of browsers or with some browsers such as Safari.
Use Google Chrome (89.0 version or newer) or Mozilla Firefox (80.0.1 version or newer) to access U-Behavior.
How can I download my RPA graph on U-Behavior?
After generating your RPA graph, you can download it by clicking on the “Download” icon, which is a blue arrow pointing down to a straight blue line. This icon may be found at the top-right of the graph.
Why can't I see all my attempts in my RPA graph?
If you don’t see all attempts in your RPA graph, it’s likely that you practiced two different RPAs on that day and obtained the same score on those attempts. In that case, the attempts will be plotted on top of one another.
To see all your attempts, you’ll need to use the interactive legend provided in U-Behavior:
- Pass the mouse cursor over one RPA title in the legend to see all the attempts for that specific RPA
- When the cursor is passed over an RPA on the legend, the application highlights only the attempts for that specific RPA
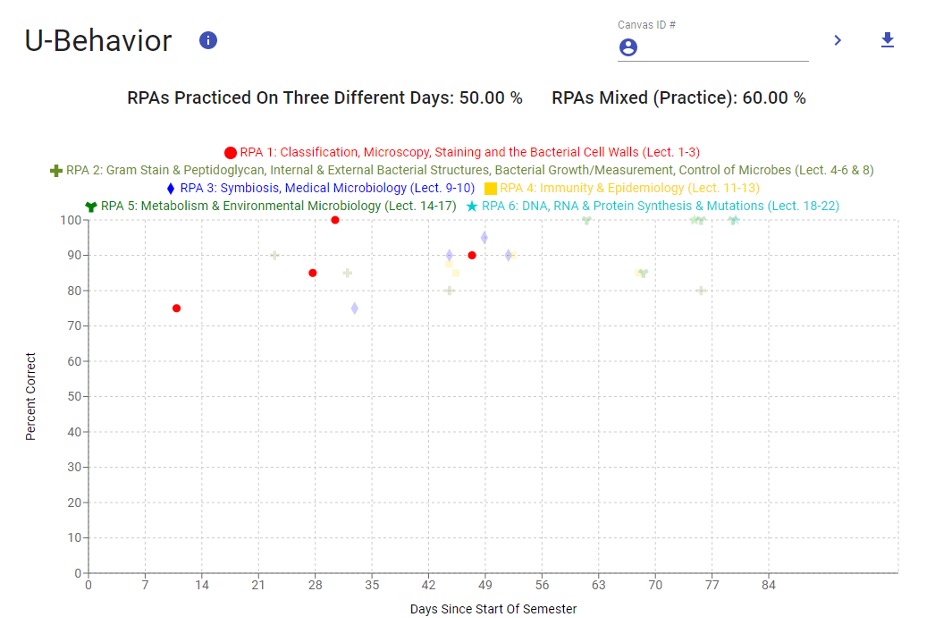
Here is an example where the student passed their mouse cursor over RPA3: Symbiosis, Medical Microbiology (Lect. 9-10) – as you can see, the blue diamonds are highlighted:
Why are my RPAs Practice on Three Different Days and/or my RPAs Mixed (Practice) scores so low?
Your scores may be low because of the following reasons:
- You have not practiced each of the RPAs on three different days, leaving at least a 24-hour gap between practice sessions
- You have not consistently mixed up the practice between RPAs
- It may be early in the semester – your score will go up as the semester progresses if you continue to space out and mix up your practice
For more information about your scores, watch The Value of Retrieval Practice Activities (RPAs) Tutorial available in your Canvas course.
As a student, how can I access U-Behavior?
If your instructor is using U-Behavior in your course, you should have access to the U-Behavior Web Application. Use the following steps to access U-Behavior:
- Log in to Canvas
- Select the course that is using U-Behavior
- The U-Behavior Web Application will be in the left navigation bar. Click the U-Behavior link and wait a few seconds for the application to load

As a student, how can I generate an RPA graph using U-Behavior?
Use the following steps to access U-Behavior and generate your RPA graph:
- Log in to Canvas
- Select the course using U-Behavior
- The U-Behavior Web Application will be in the left navigation bar. Click on the U-Behavior link and wait a few seconds for the application to load
- Your RPA graph will automatically be generated for you
Does U-Behavior generate an interactive RPA graph?
Yes, you can interact with your RPA graph in the following ways:
- RPA Detail: By passing the mouse over a specific attempt (e.g., a red dot on graph), you will have access to details of that attempt. The example below shows the details of the first attempt for RPA 1: Classification, Microscopy, Staining and the Bacterial Cell Walls (Lect. 1-2):
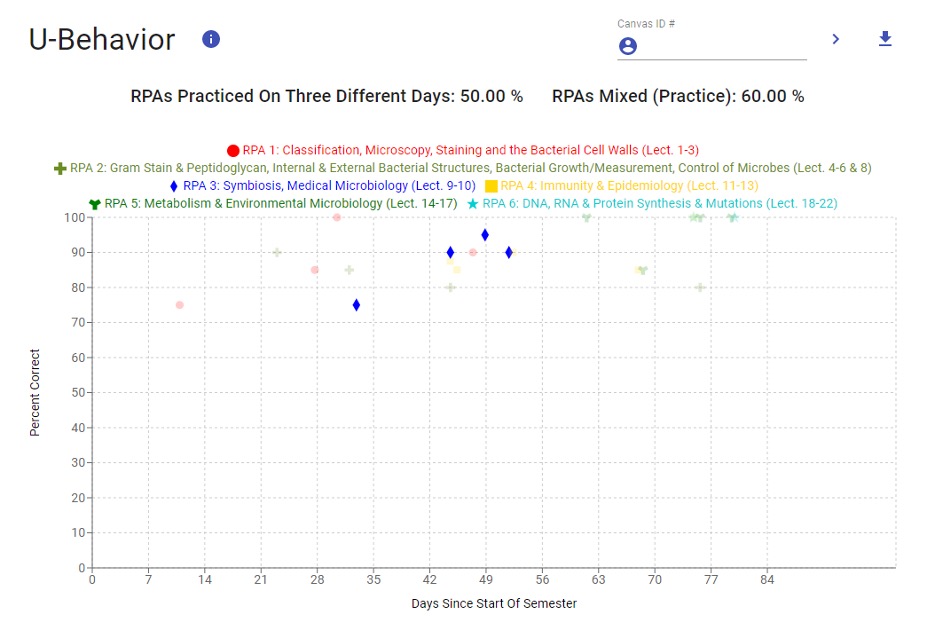
- RPA Legend (highlighting all attempts for that RPA): By passing the mouse over one specific RPA title in the legend, U-Behavior will highlight all attempts of that RPA. The example below shows all attempts for RPA 1: Classification, Microscopy, Staining and the Bacterial Cell Walls (Lect. 1-2):
You can access a brief tutorial on how to interact with your RPA graph by clicking in the “Information” icon, which is a white lower-case letter “i” enclosed within a blue circle.
How can I interpret my RPA graph?
X-axis: The x-axis represents the days since the semester started.
Y-axis: The y-axis represents the percent correct.
Plotted item: Each attempt plotted on the graph includes the day in which that attempt occurred and the percentage correct for that attempt. Each attempt has a different shape and color. The shape and color are related to a specific RPA, which is presented in the legend of the RPA graph that also contains the title of each RPA.
RPAs Practiced On Three Different Days: The percentage of RPAs you have practiced on at least three different days.
RPAs mixed (Practice): The percentage of your mixed practice of different RPAs. All percentages are calculated based on the total number of RPAs that you are to practice during the entire semester. Therefore, your score will increase as the semester progresses.
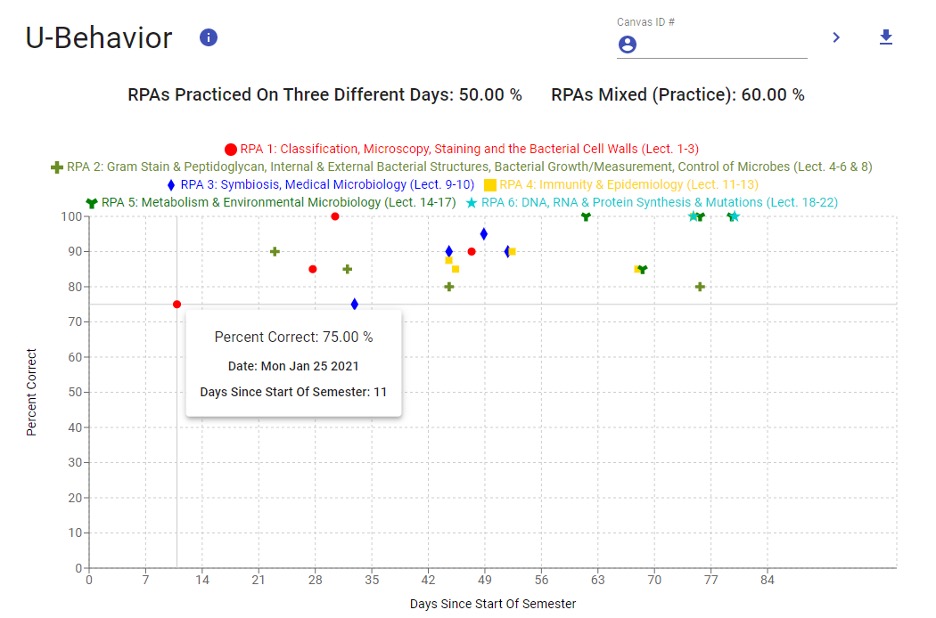
Interactive plots: You can pass the mouse over each individual attempt to have access to details of that attempt, such as:
- Percent correct
- Date
- Days since start of semester
Interactive legend: You can pass the mouse over each RPA title presented in the legend and U-Behavior will highlight only the attempts related to that RPA.
As an instructor, how can I generate an RPA graph using U-Behavior?
Use the following steps to access U-Behavior and generate a RPA graph:
- Log in to Canvas
- Select the course that is using U-Behavior
- The U-Behavior Web Application will be located in the left navigation bar. Click on the U-Behavior link and wait a few seconds for the application to load
- Enter your student Canvas ID number and click on the “Next” icon, which is a right-pointing caret
- Your student’s RPA graph will be generated in a few seconds
- You can download your student RPA graph by clicking the “Download” icon, which is a blue arrow pointing down to a straight blue line
- Repeat steps 4-6 for each student for whom you would like to generate an RPA graph